
April 19th 2010
Forex Seasonality: Is it Real?
I have always wanted to write a post about seasonality, but whenever push came to shove, I couldn’t see the point. Besides, I was never sure whether seasonality falls into the scope of technical analysis or whether it made sense to consider in fundamental terms, and for fear of overstretching, I stayed away. Recently, I read a column by Kathy Lien about forex seasonality. In fact, this article was merely an updated version of a nearly identical article that she contributed earlier to Investopedia, but nonetheless I found it informative, and I was finally inspired to address the topic on the Forex Blog.
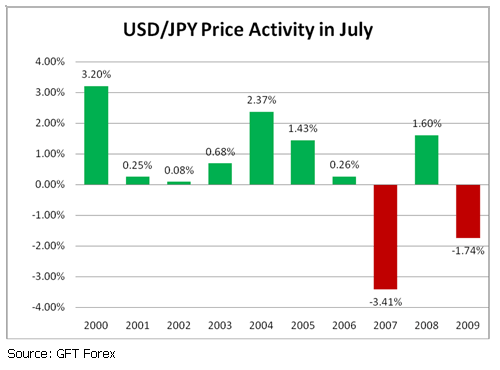
Basically, Lien’s analysis consisted of examining 10 years of data for a handful of major currency pairs, and picking out the month(s) for each pair in which performance tended to be most lopsided. (Since forex is zero-sum, it should be the case that over a long enough time horizon, the average fluctuation for every pair should sink to ~0%. For other types of securities/investments, this type of analysis might be less viable). She discovered that the USD has tended to rise against in the Yen in July, but to fall in August. Meanwhile, the Dollar has tended to rise against the Euro in January, and fall against the Canadian Dollar in May. A similar study by DailyFX found that the US Dollar has also tended to rise against the Dollars of Australian, New Zealand, and Canada in the month of July.
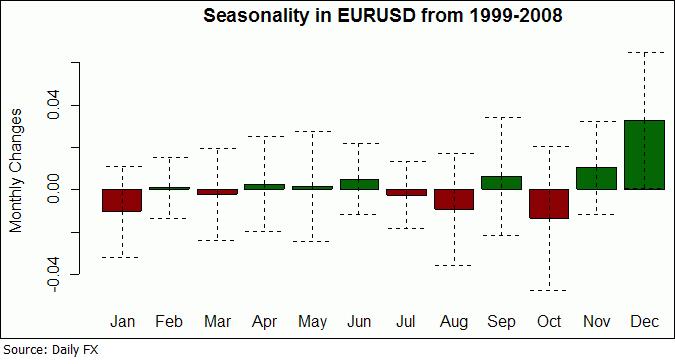
These numbers are certainly interesting. But, I want to offer a clarification that the authors, themselves, didn’t bother to make. Namely, when making statistical claims about trends, it’s important to perform statistical (and not just visual) analysis. For example, the fact that the authors based all of their conclusions on only 10 years of data means that the case for statistical significance (a mathematical concept which states that a certain result cannot be a product of pure chance) is not as strong as you would think. Given that major currencies have floated since 1973, there is at least 30 years of good data which can and should have been used in the analysis.
For example, Lien observed that the US Dollar rose 80% of the time against the Yen against in the month of July. Given that the sample size (10 years) is only a fraction of the total data (let’s assume 30 years), we can say with 95% confidence (in accordance with statistical theory) that the actual fluctuation is somewhere between 60% and 100%. If you want to be 99% sure, then the interval expands to 53 to 100. To be fair, most traders would be perfectly happy with 95% confidence, and in this case, that means we can be 95% sure that the Dollar will rise against the Yen at least 60% of the time in the month of July. That’s not great, but still better than a coin-toss. If you bet on this trend every July over the next 10 years, then, you can be 95% sure that you will come out ahead. However, the average return over the last 10 years for this particular trend is only .39%, or 4.8% on an annualized basis. That’s not that impressive considering the margin of error and the amount of work that you had to do.
As if this were not enough, Lien can’t even proffer an explanation why this is the case. (I’m certainly not blaming her; frankly I would be hard-pressed to come up with anything convincing). Being a fundamental analyst, personally, I like to have some idea (or delude myself into thinking I have some idea) as to why a certain trend exists, and I’m not content to simply take it as face value. Thus, even if statistical theory tells me that this particular trend probably isn’t a product of pure chance, from where I’m sitting, it might as well be.
Actually, I was much more impressed with a similar piece of analysis that Lien published on FX 360, which looks at how volatility varies for USD/X currency pairs, from month-to-month. For all of the currency pairs that Lien examined, there is a clear pattern: volatility peaks in December/January and reaches a low in the summer. Not only is this trend clearly discernible, but also neatly explicable. In all of the financial markets, trading activity (and volatility, by extension) dries up in the summer as investors go on vacation. It slowly builds during the end of the year as portfolio managers churn their positions to try to meet their annual targets.
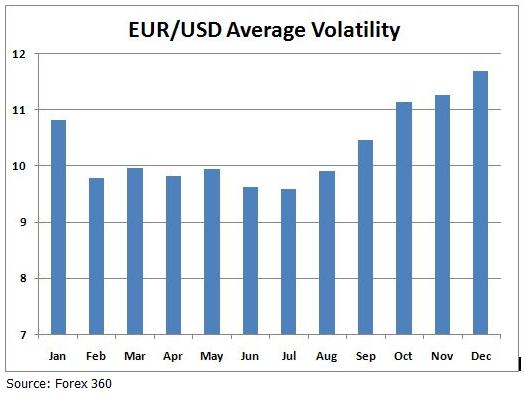
From a practical standpoint, there are a few takeaways. First, if you’re a carry trader, know that the risk is generally higher in the winter than in the summer. While many traders may complain about the lack of fluctuation in July and consequent difficulty of profitably day trading, you can sit back and earn a low-risk return on the interest rate spread.
With regard to the monthly trends for specific currency pairs that I referenced at the beginning of this post, I would say that they are certainly worth being aware of, especially if you’re a swing trader and tend to hold your positions for only a month. For shorter or longer-term trading, however, I don’t think most of these trends are actionable. Even in the handful of trends that seem to be bullet-proof, the fact that you must enter into the trade on the 1st of the month and exit on the last day of the month (since it’s on that basis that the trends were analyzed) would seem contrived and annoying.
I have to admit- I’m intensely curious as to whether anyone has actually tried to trade on such a strategy. Please share your experiences below!


April 19th, 2010 at 12:24 pm
You can find seasonality data with 35 years worth of data for futures and 36 for spot at this site http://www.seasonal-charts.com/
I’d appreciate your opinion on it,
IEV
April 23rd, 2010 at 4:02 pm
[…] Adam Kritzer discusses seasonality in forex and finds interesting conclusions. […]
April 25th, 2010 at 9:15 am
The direction of a currency pair simply does not reset every year like the seasons do. The currency pair flows through time constantly changing, affected by many things like the weather, tsunamis, financial crisis, interest rates, to economic and social policy and so forth. Many nations that were good investments might not exist in the near future. However summer will always be around the corner.
Sectioning up time into 4 repeating parts explains a rather simple system – like an elliptical rotation, and where on a rotating sphere receives the most energy. The phases repeat over and over again. It can all be written out in a fairly small and simple equation, and then looped.
What seasonality tries to do in my opinion, is condense an extremely complicated subject that changes very rapidly because it is human-oriented, into a short dumbed-down equation.
It doesn’t make sense to me. Is Forex more like a river system or a pendulum?
At the end of the day, if most traders traded with astronomy, so would I.
December 28th, 2010 at 9:25 am
The best Forex pair to trend is the best trending pair. Without a trend the market would essentially be random. The EUR/USD trends the best.